IPRO Workbench
IPRO Workbench is the integrated development environment (IDE) that INTELPRO provides for the IPRO series of chips. In a single window you build IPRO SDK applications, flash them to the board and watch the board's serial output. It also provides C/C++ code navigation, pin configuration, GATT configuration, memory analysis, crash analysis, on-board tests, RF, Wi-Fi throughput and power measurement, and an AI assistant that can build and flash by itself.
The pages in this section use the IPRO7AI Reef EVK V4.0 with the IPRO Debug Probe for their examples. Every step says what to do and what you should see; when the screen does not match, see Troubleshooting. With the IPRO6S EVK the steps for building, flashing and monitoring are the same; what differs is collected in the IPRO6S EVK section of Flashing and the Board. If you work in VS Code instead, see VS Code Extension.
Availability
IPRO Workbench 0.1.1 (preview) for macOS and Windows is on the IPRO Workbench releases page on GitHub; no GitHub account is needed. There is no Linux version yet. See Install IPRO Workbench.
What it does
| Feature | Description |
|---|---|
| Complete the environment | Checks the SDK, the RISC-V toolchain, CMake, Python, IntelProCube and the board automatically, and installs anything missing from GitHub with one click. |
| Build, flash and monitor | One button builds, flashes and opens the serial monitor. The output of each step is shown separately; if any step fails, it stops and explains why. |
| Application management | Lists the applications in the SDK by category; creates a new application from a board's Hello World or from an existing example. |
| Settings (Kconfig) | Edits the application's .config in a form, writes only the options you change, and shows the help text and dependencies of each option. |
| Pin configuration | Assigns the function of each GPIO on a package drawing and in a table, checks for conflicts and against the board's wiring, and generates initialization code. |
| GATT configuration | Defines BLE services and characteristics in a form, checks UUIDs, lengths and the application's settings, and generates the GATT service code; see Configuring GATT Services. |
| Memory analysis | Shows which libraries, object files and symbols use flash, ocram and hbnram; compares the size change from build to build, and lets you set a memory budget. |
| Flashing and the board | Partition table view and check, detection of the board's flash, checking the firmware running on the board, and writing AI models to the mfg partition; the IPRO6S EVK is flashed with its own partition table. |
| Serial monitor | Filtering, timestamps, saving and full logging, a serial plotter, and monitoring a second port at the same time. |
| Debugging and analysis | Decodes crash addresses into source lines automatically, collects and analyzes crash dumps, and looks up registers and their fields. |
| Testing and measurement | On-board test results in the Testing view, RF tests (BLE DTM), Wi-Fi throughput (iperf), power curves and battery life estimates. |
| AI assistant | The built-in IPRO AI assistant builds, reads the output, and changes settings, pins and GATT services by itself; AI assistants outside the IDE (for example Claude Code) can use the same set of tools through MCP. |
Window areas
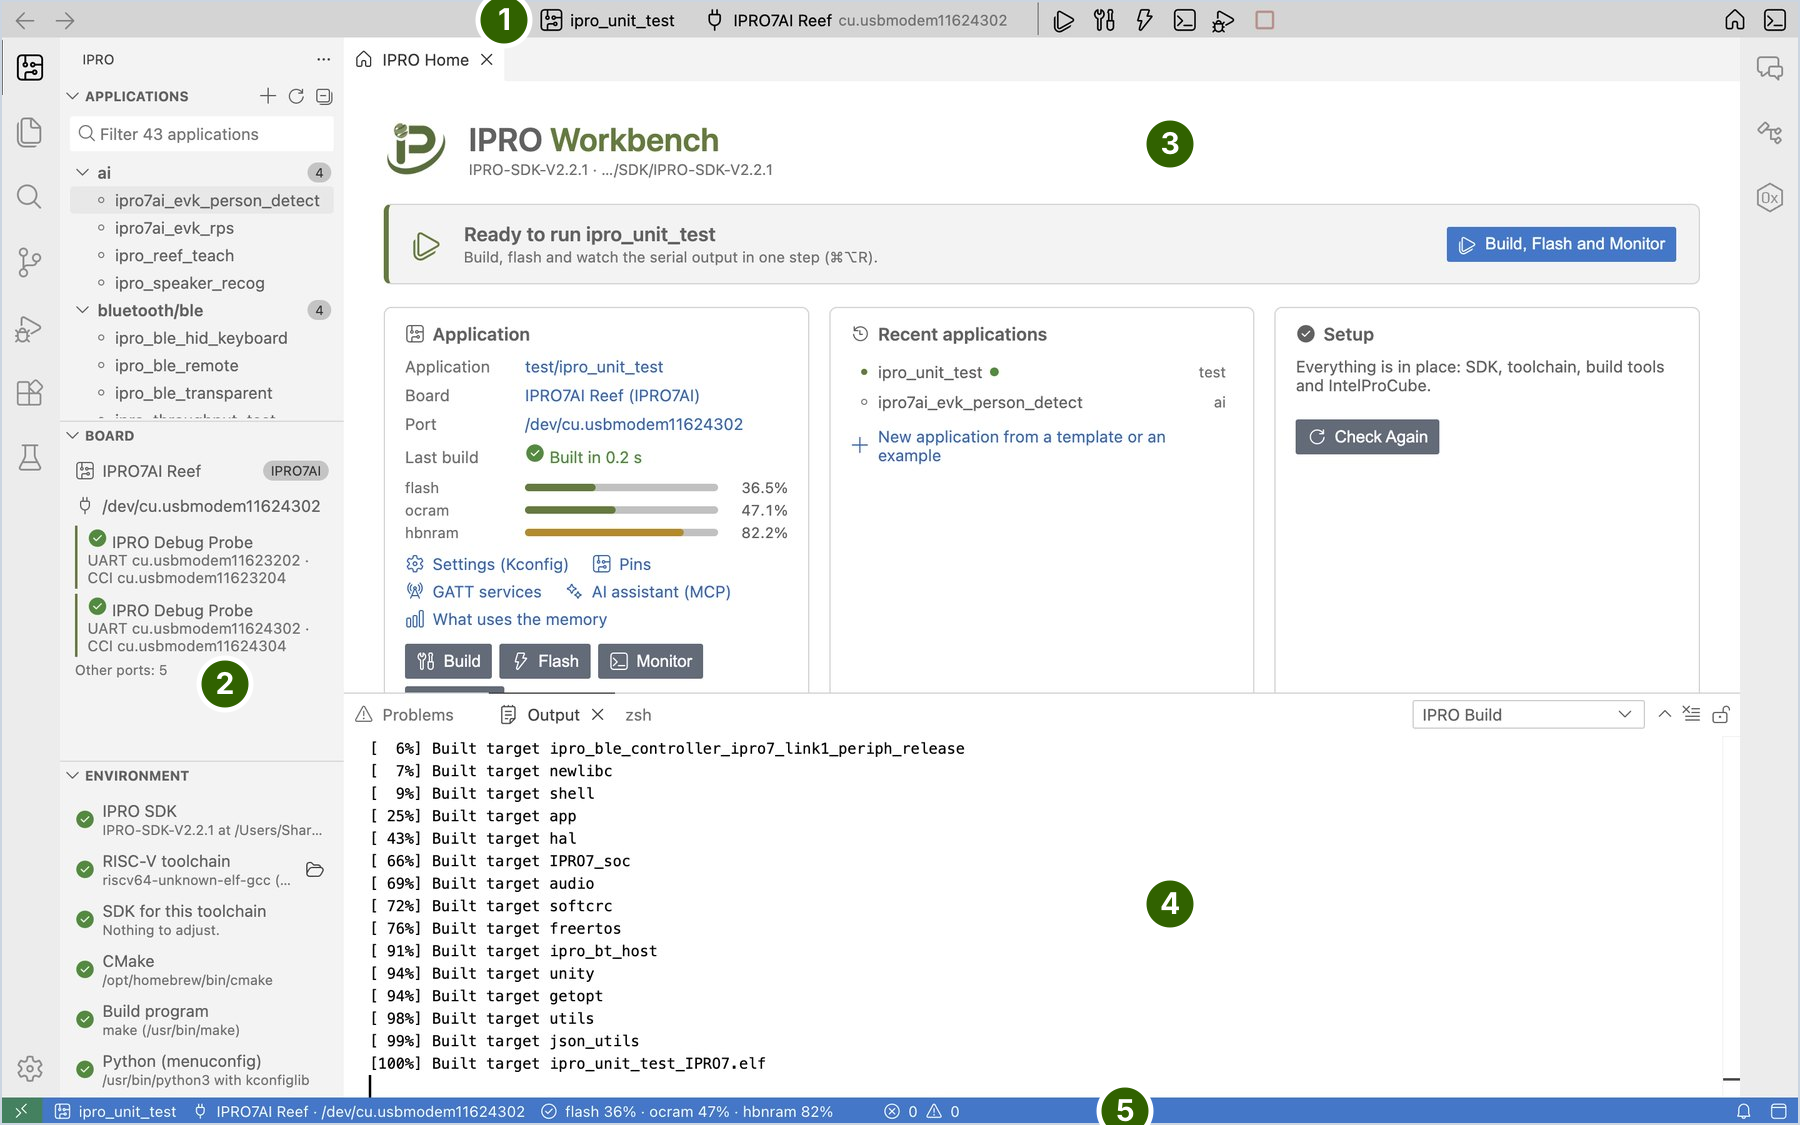
| No. | Area | Purpose |
|---|---|---|
| 1 | Toolbar | The current application, board and port, and buttons such as build, flash and monitor. Click the application or board name to change it. |
| 2 | IPRO side bar | Applications lists the applications in the SDK; Board shows the probe, its ports and the firmware running on the board; Environment lists the check results item by item. |
| 3 | Editor area | IPRO Home, source code, and views such as settings, pins, memory map and partition table all open here. |
| 4 | Bottom panel | In Output, IPRO Build, IPRO Flash and IPRO Setup show the build, flash and installation processes respectively; IPRO Monitor in Terminal is the serial monitor. |
| 5 | Status bar | The current application, board and memory usage; it also reminds you here when something is missing from the environment. |
IPRO Home
IPRO Home is the first tab in the editor area after you open an SDK. If you close it, click the house icon at the right of the toolbar (IPRO Home) to open it again.
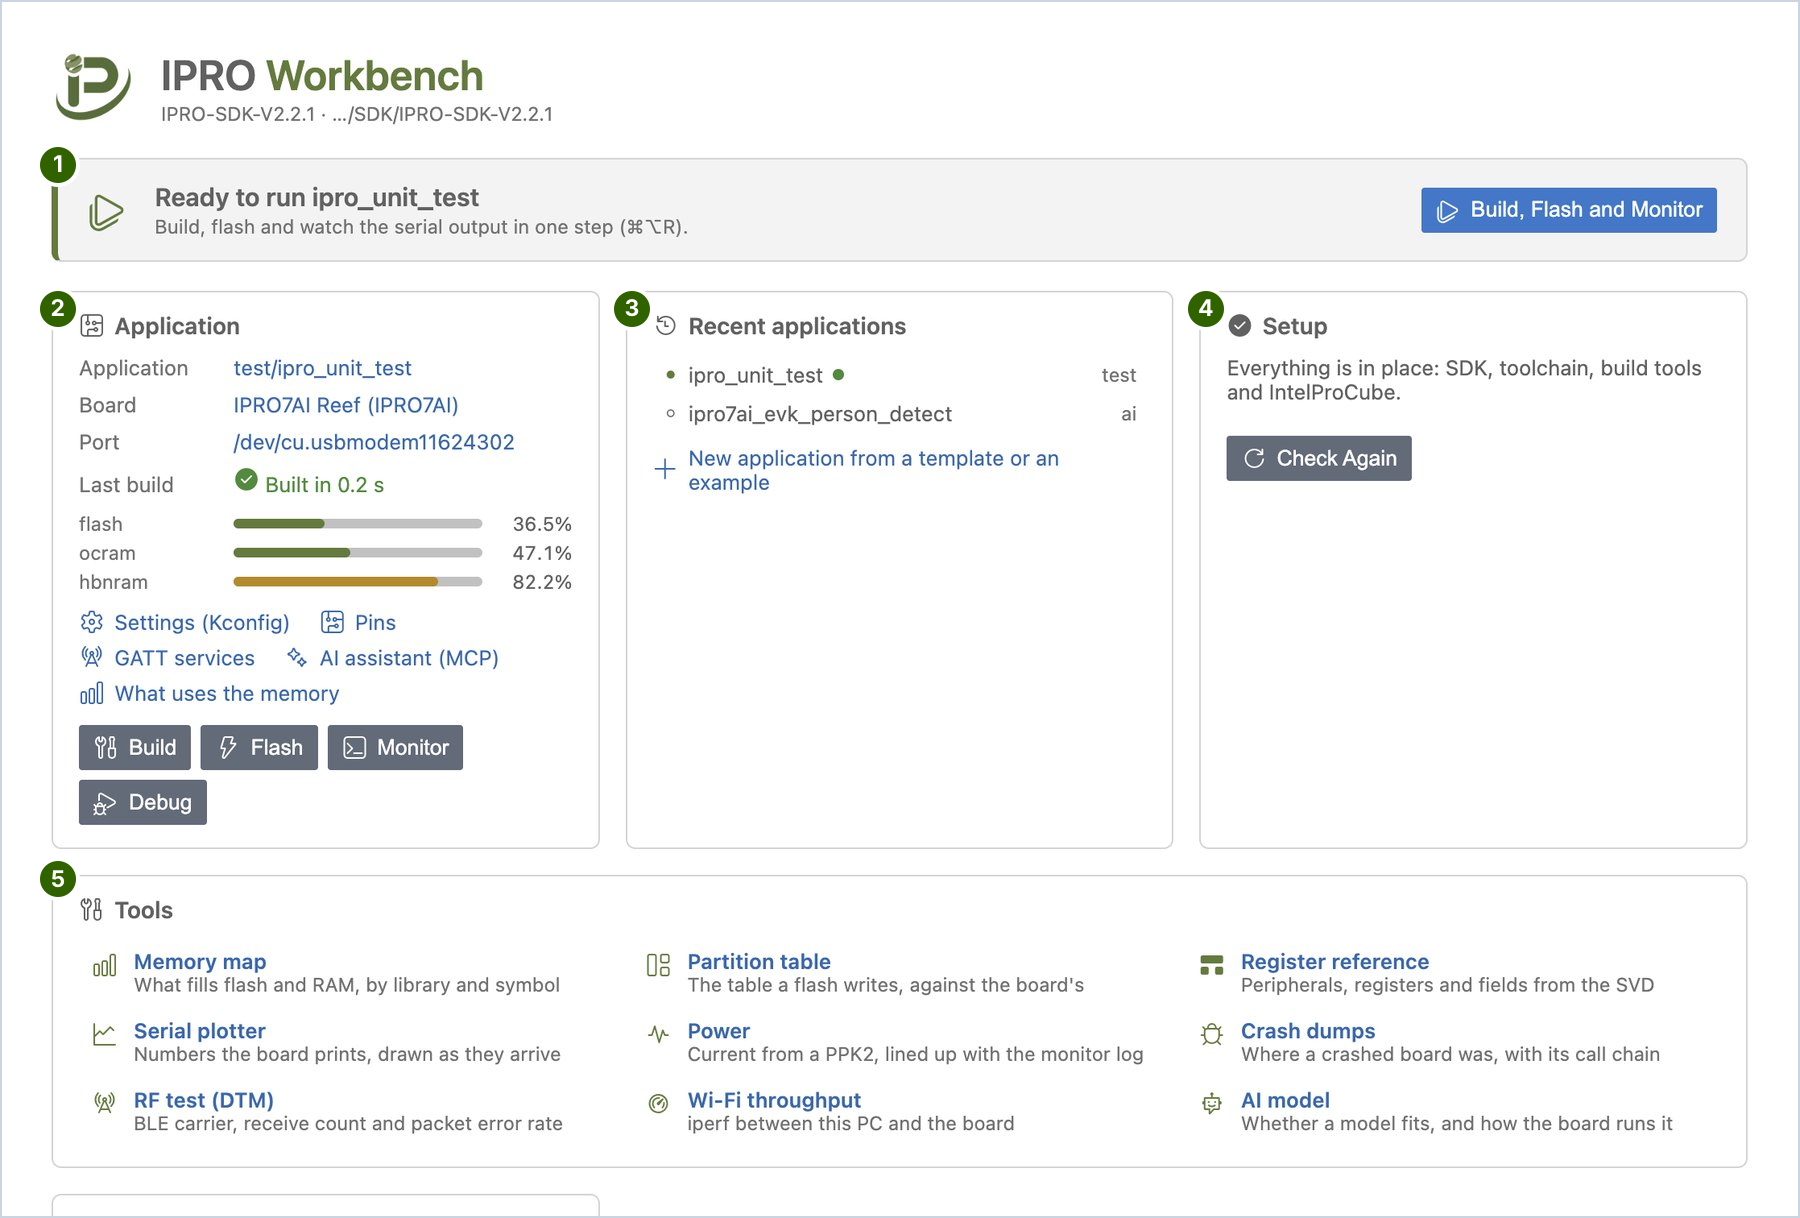
| No. | Area | Purpose |
|---|---|---|
| 1 | Banner | Always shows the "next step": before an SDK is open it asks you to open the SDK, when something is missing from the environment it asks you to complete the environment, and when everything is ready it shows "<application> is ready to run" with the Build, Flash and Monitor button. |
| 2 | Application | The current application, board and port (click one to change it); links to Settings (Kconfig), Pins, GATT services and AI assistant (MCP); the Build, Flash, Monitor and Debug buttons. After a build it also shows the memory usage. |
| 3 | Recent applications | The applications you used most recently; click one to switch to it. You can also create a new application from here. |
| 4 | Setup | A summary of the environment check with Check Again; when something is missing it shows Fix Environment. |
| 5 | Tools | The way into the nine tool pages: Memory map, Partition table, Register reference, Serial plotter, Power, Crash dumps, RF test (DTM), Wi-Fi throughput and AI model. Each has a line saying what it is for; click the name to open the page. |
The tool pages all open in the editor area and share one layout: the title and the application the page is about at the top, then the options and buttons, then the results. The same commands are in the IPRO menu and in the command palette (type IPRO).
Supported environment
| Item | Details |
|---|---|
| Computer | macOS 12 or later (Apple silicon); Windows 11 (x64) |
| IPRO SDK | IPRO SDK 2.2.1 (the IPRO6S EVK needs 2.2.1 or later; the steps for the IPRO7 series are the same on 2.2.0) |
| Chips | IPRO7, IPRO7AI, IPRO6S (builds the SDK's IPRO6 applications) |
| Boards | IPRO7AI Reef EVK V4.0, IPRO6S EVK |
| Flashing and connection | IPRO Debug Probe (USB); flashing uses IntelProCube (the IPRO6S EVK needs 0.7.0.1 or later) |
| Interface languages | Traditional Chinese, English |
Workflow
-
Install and complete the environment. Install IPRO Workbench, let Fix Environment install the SDK and the tools, open the SDK and connect the board through the IPRO Debug Probe; see Install IPRO Workbench.
-
Run a first application. Select
ipro_unit_test, click Build, Flash and Monitor and wait forALL TESTS PASSED, then create an application of your own; see First Run. -
Develop. Change settings (Kconfig) in a form, assign pins and generate their code, define GATT services and generate their code, fix build errors and see where the memory goes; see Develop an Application.
-
Flash. Flash with the IDE's checks, compare the partition table with the board, write AI models to the mfg partition, and build, flash and monitor the IPRO6S EVK; see Flashing and the Board.
-
Monitor. Watch, filter, timestamp and save the board's serial output, and plot the numbers it prints; see Serial Monitor.
-
Debug and measure. Decode crash addresses, collect crash dumps and look up registers, then run board tests, RF tests, Wi-Fi throughput tests and power analysis; see Debugging and Analysis and Testing and Measurement.
Full manual
The IPRO Workbench Operation Manual V1.2 covers IPRO Workbench 0.1.1 as a PDF attached to the 0.1.1 release: English (73 pages) or Traditional Chinese (67 pages). It is also listed under Documents.
Pages in this section
-
Download and verify the installer, install on macOS and Windows, the interface language, completing the development environment, opening the SDK and connecting the board.
-
Build, flash and monitor
ipro_unit_test, create your own application, and the application context menu. -
Settings (Kconfig), pin configuration and generated code, GATT services and generated code, builds and errors, the memory map, size changes and the memory budget.
-
Flashing and its checks, the partition table, the board's flash and firmware check, writing AI models to mfg, and the IPRO6S EVK.
-
Opening the monitor and typing commands, filter, timestamps, saving and full logs, the serial plotter and a second port.
-
Automatic crash address decoding, crash dumps with the full call chain, and the register reference.
-
Board tests in the Testing view, RF tests in BLE Direct Test Mode, Wi-Fi throughput with iperf, and power curves with battery life estimates.
-
Turning on AI features, asking AI to fix a build error or analyze a crash, and letting AI assistants outside the IDE use it through MCP.
-
Messages on screen, toolbar and side bar status, macOS and Windows issues, and what to send when you report a problem.
-
Shortcuts, Commands and Settings
Keyboard shortcuts, IPRO commands,
ipro.*settings, MCP tools and the files and folders the IDE uses.
Scope of this release
These pages cover the IPRO Workbench 0.1.1 preview. This release has the following limitations:
- The installers are not signed by Apple or Microsoft, so the operating system shows a prompt the first time you open or install IPRO Workbench (see Install for what to do).
- Debugging over JTAG is not available yet. If the board crashes, use the crash decoding and crash dumps described in Debugging and Analysis instead.
- Automatic updates are off by default. To get a new version, download it from the releases page and install it again.
- IPRO6 series boards print no build time or partition table at boot, so Board does not show which firmware the board runs, and the partition table is not compared with the board's.
- Wi-Fi throughput (iperf): the network name and password cannot contain spaces, and the board echoes the password in the serial monitor.
- There is no Linux version yet.