Serial Monitor
IPRO Monitor is the serial monitor in the Terminal of the bottom panel. It shows what the board prints over UART, and you can type commands straight to the board.
Open the monitor and type commands
-
Open the monitor. Click Serial Monitor (
Cmd+Alt+M/Ctrl+Alt+M). With Build, Flash and Monitor, it opens automatically after flashing.You should see: an IPRO Monitor <port> terminal opens at the bottom, at 115200 baud by default.
-
Type a command. Type in the monitor and press Enter to send, for example
help.You should see: the board's shell replies with the commands it supports.
-
Reboot the board. Click Reset Board: the IDE resets the board through the probe, and the monitor stays open and shows everything from the first boot line.
Note
- Before flashing or resetting, the IDE closes every monitor and opens them again when it is done.
- Change the baud rate in the
ipro.monitor.baudRatesetting; after the change, the monitor reopens automatically. - The monitor automatically decodes the addresses the board prints into source locations; see Debugging and Analysis.
Tools on the monitor tab
The panel that holds the IPRO Monitor tab has a few buttons at its top right; the command palette and the IPRO menu have the same commands.

| No. | Icon | Command | Purpose |
|---|---|---|---|
| 1 | Funnel | Filter Monitor Output… | Shows only the matching lines |
| 2 | Stopwatch | Show Monitor Timestamps | Adds the time each line was received in front of it |
| 3 | Disk | Save Monitor Output… | Saves the current content as a text file |
| 4 | Line chart | Serial Plotter | Plots the numbers the board prints as curves |
Filter
-
Set a filter. Click the funnel icon (Filter Monitor Output…), type what to keep, for example
ERROR|WARNorPASS|FAIL(a regular expression, not case-sensitive), and press Enter.You should see: the monitor reopens, the tab title gains
/ERROR|WARN/at the end, and only matching lines are shown. Crash messages (MEPC, ra, stack backtrace) always show. -
Clear the filter. Click the funnel icon again, empty the input box and press Enter.
The filter judges a line only once the whole line has arrived, so the shell prompt shows only after you press Enter.
The filter only changes what is shown: the firmware check, the partition table comparison and the board tests still read every line the board prints, so they work with a filter on.
Timestamps
Click the stopwatch icon (Show Monitor Timestamps).
You should see: each line starts with the time it was received, for example [23:33:13.227] (by this computer's clock). Click again to turn it off.
Saving and full logs
-
Save what is on screen. Click the disk icon (Save Monitor Output…), choose a location and click Save.
You should see: a notification says "Saved the monitor output to monitor-….txt." What is saved is the content the terminal currently keeps (by default the last 1000 lines).
-
Keep a full log of every session. Open Settings, search for
ipro.monitorand check Log To File.You should see: the first line of the monitor says
logging to …/build/logs/monitor-<date>-<time>.log. The file holds everything the board printed, unfiltered and without colors. When you measure power, this log can be lined up with the current curve (see Testing and Measurement).
Serial plotter
-
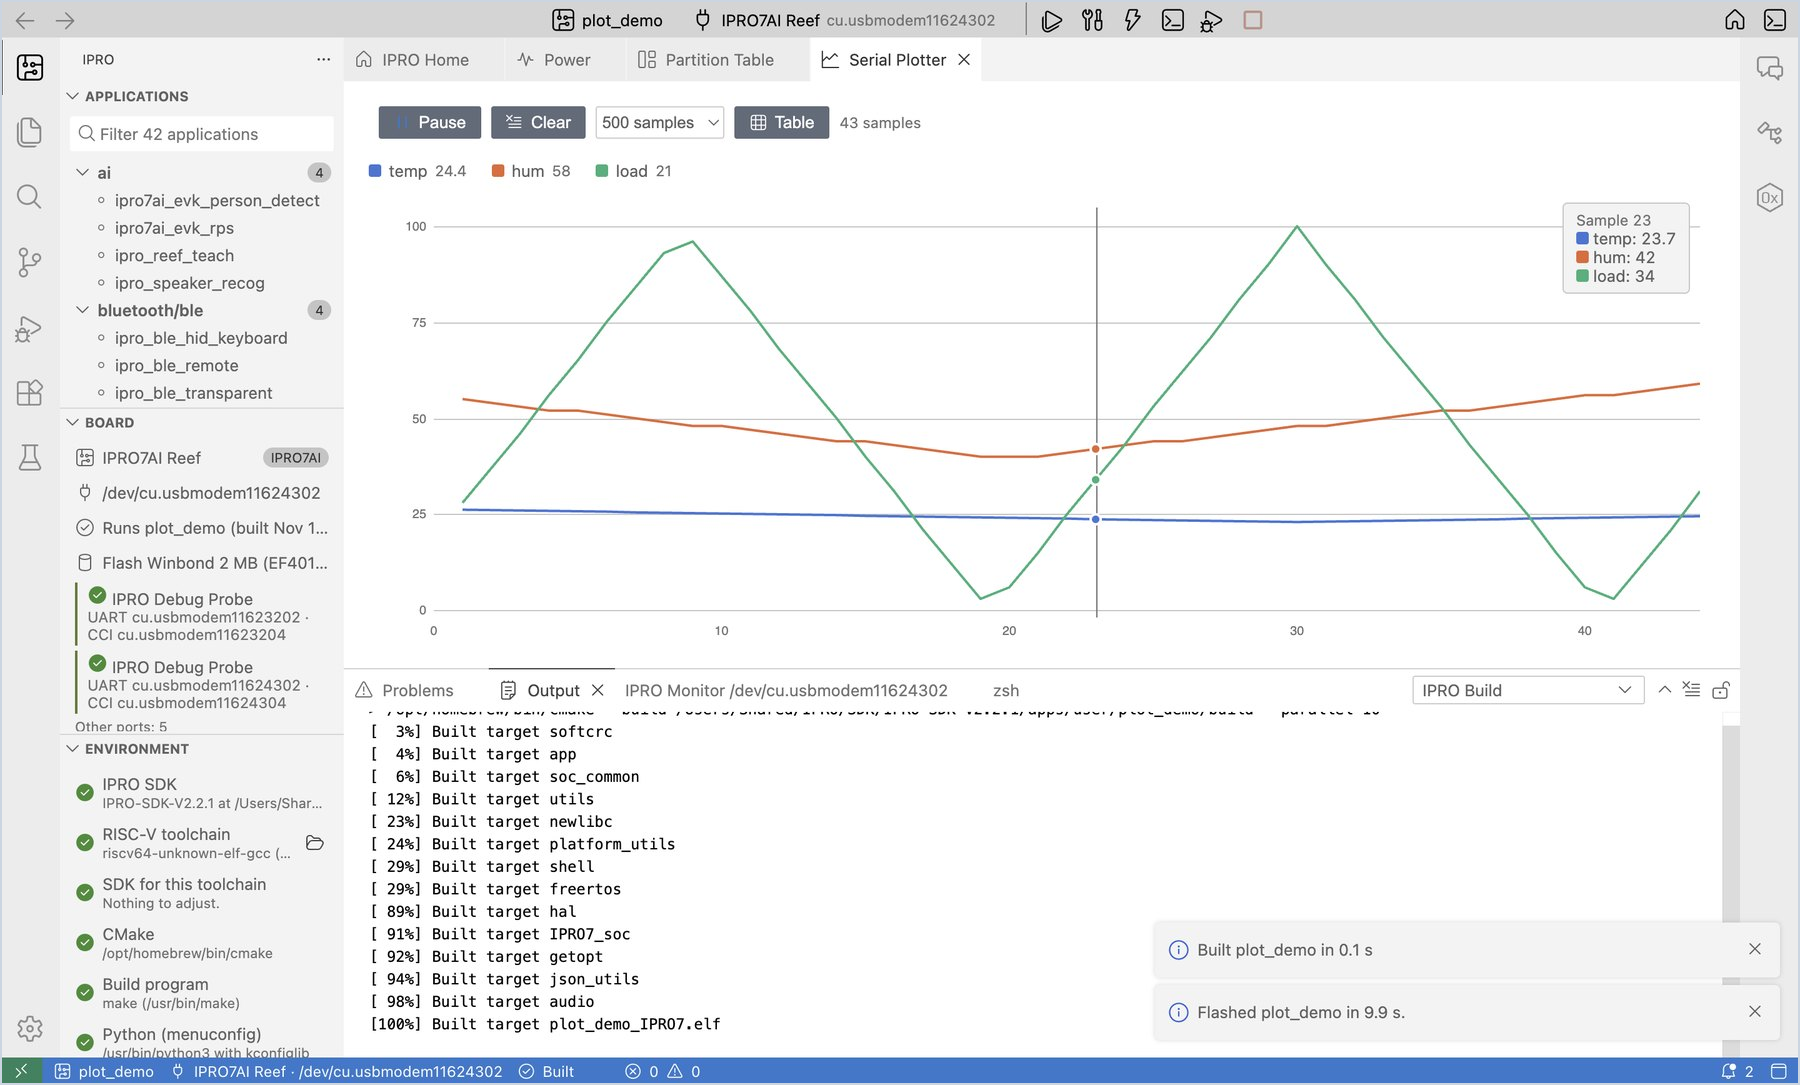
Print numbers. Have the firmware print numbers on each line, for example
temp:23.5,hum:40(name:value) or1.2 3.4(separated by spaces or commas). -
Open the plotter. With the monitor open, click the line-chart icon on the monitor tab (Serial Plotter).
You should see: Serial Plotter opens in the editor area, with one line per name (up to 8), and the legend at the top shows the latest values. Hover over the chart to list all the values of that sample.
-
Control the display. Click Pause / Resume to freeze or resume the display, and Clear to start over; click a name in the legend to hide or show that line; click Table to see the numbers instead.
Monitor another port at the same time
To watch two boards at once, or the CCI port of the probe:
-
Open a second monitor. Choose Open Monitor on Another Port… from the IPRO menu and select the port.
You should see: the ports of the probe (UART, CCI) are at the top of the list; ports that already have a monitor open are not listed. Once you choose one, another IPRO Monitor tab appears.
-
Use both. You can type in both monitors. When you flash or reset, every monitor is closed first.
Note
On Windows, a COM port can be used by only one program at a time. To use another serial tool, close IPRO Monitor first.