Testing and Measurement
Running tests on the board, measuring BLE RF, measuring Wi-Fi throughput, and looking at power curves. These tool pages all open from the Tools card on IPRO Home or from the IPRO menu.
Board tests
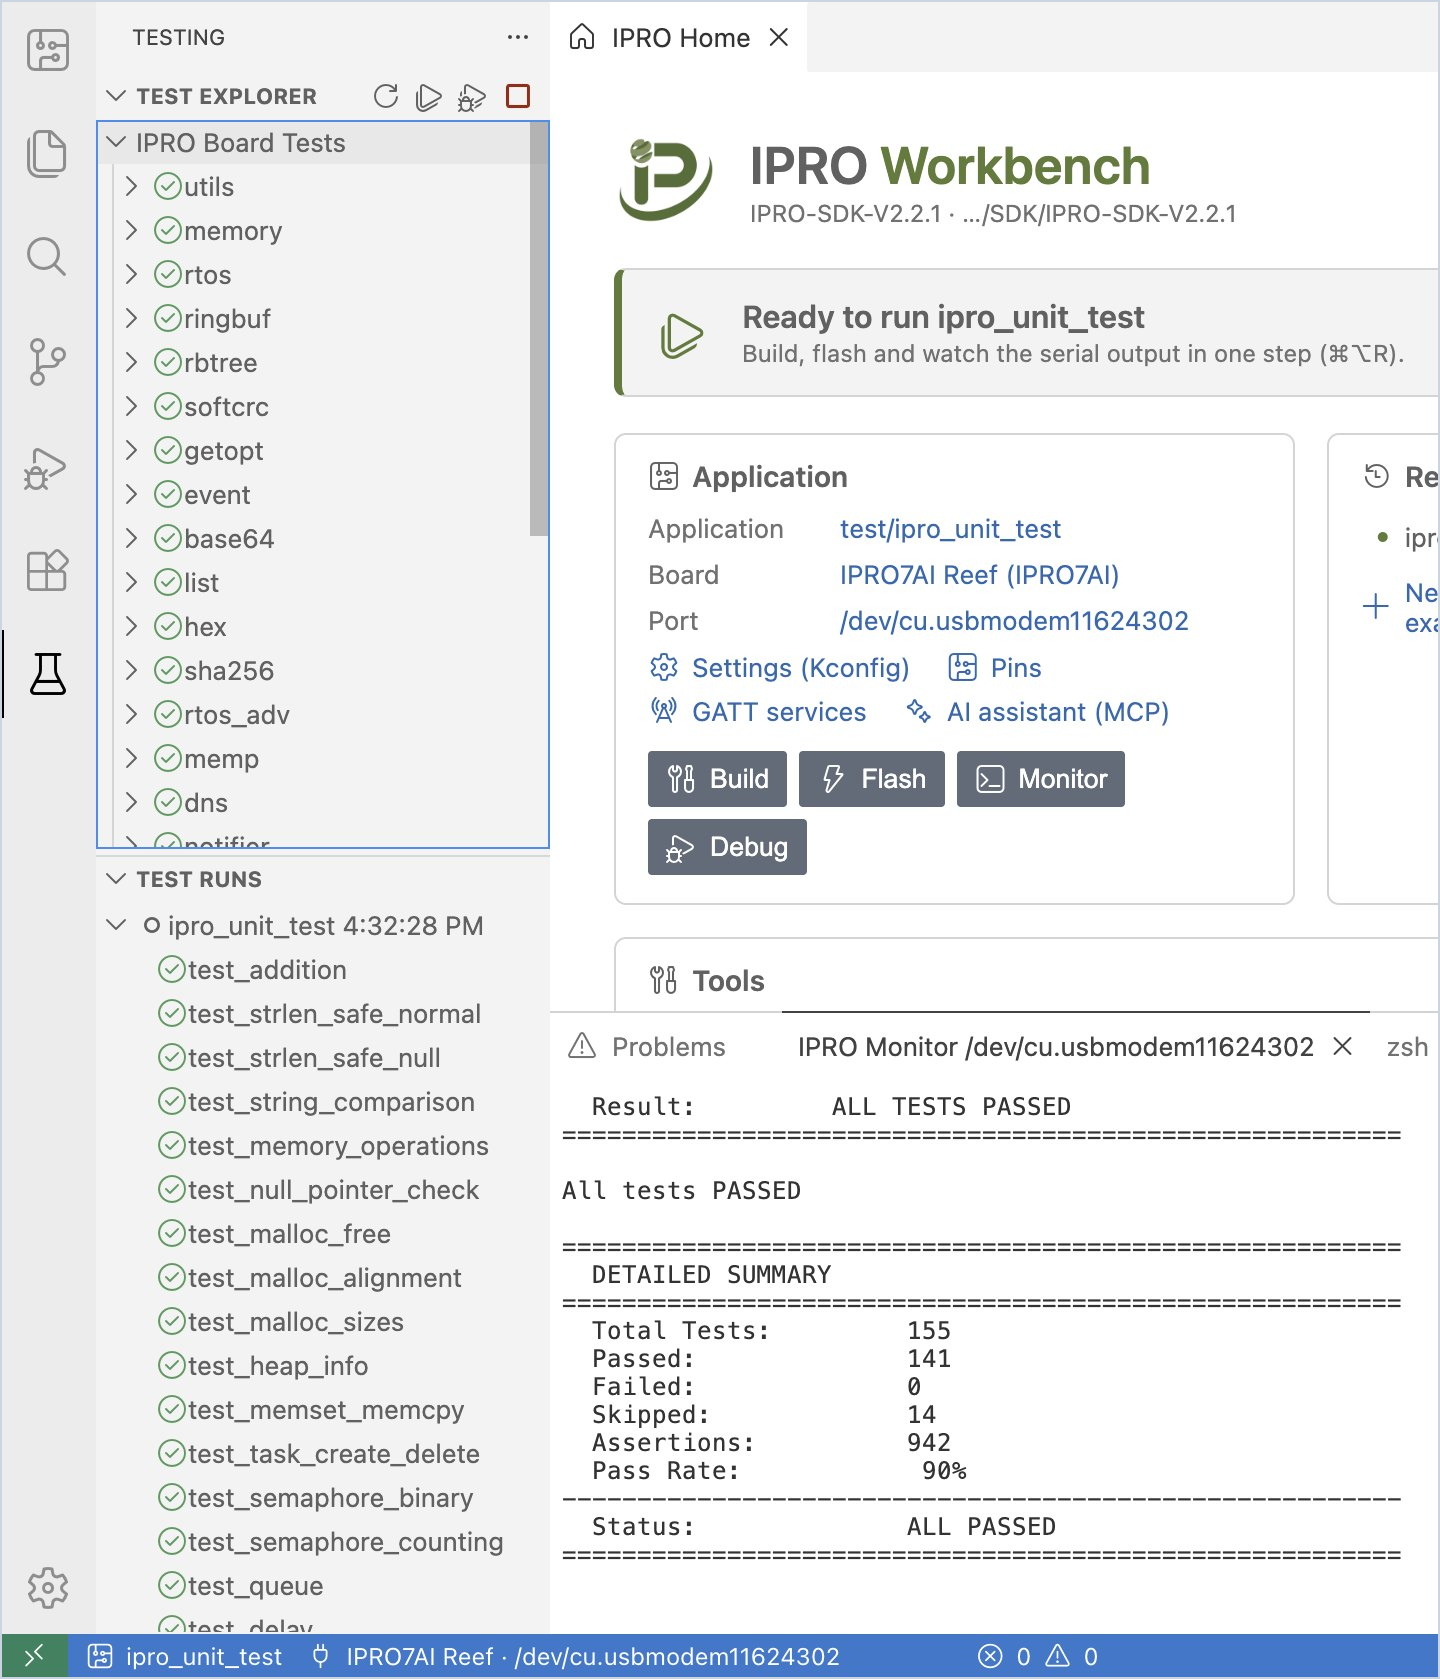
When an application uses the SDK's Unity test framework (for example ipro_unit_test), the test results the board prints are collected into the IDE's Testing view.
-
Run the tests. After you select the application and flash it once, click the beaker icon (Run Tests on Board) at the top of the Board view in the side bar.
You should see: a notification says "Resetting the board with the monitor open…", and the board reboots through the probe. The left side switches to the Testing view: Test Runs lists this run (for example "ipro_unit_test 2:10:16 PM"), with a passed, failed or skipped symbol in front of each test; in Test Explorer, IPRO Board Tests lists every test group (utils, memory, rtos…).
-
Open a failure. Double-click a failed test to open the test's source code at the line that failed.
-
Results after every run. When you run Build, Flash and Monitor, the results also go to the Testing view automatically.
Note
- The Testing view reads the test lines the board prints after it boots, so the monitor must be on the UART (console) port of the probe. A monitor filter does not affect the results.
- When the board does not reboot, the IDE says "The board did not restart. Is the monitor on the console port of an IPRO Debug Probe?"
RF test (BLE DTM)
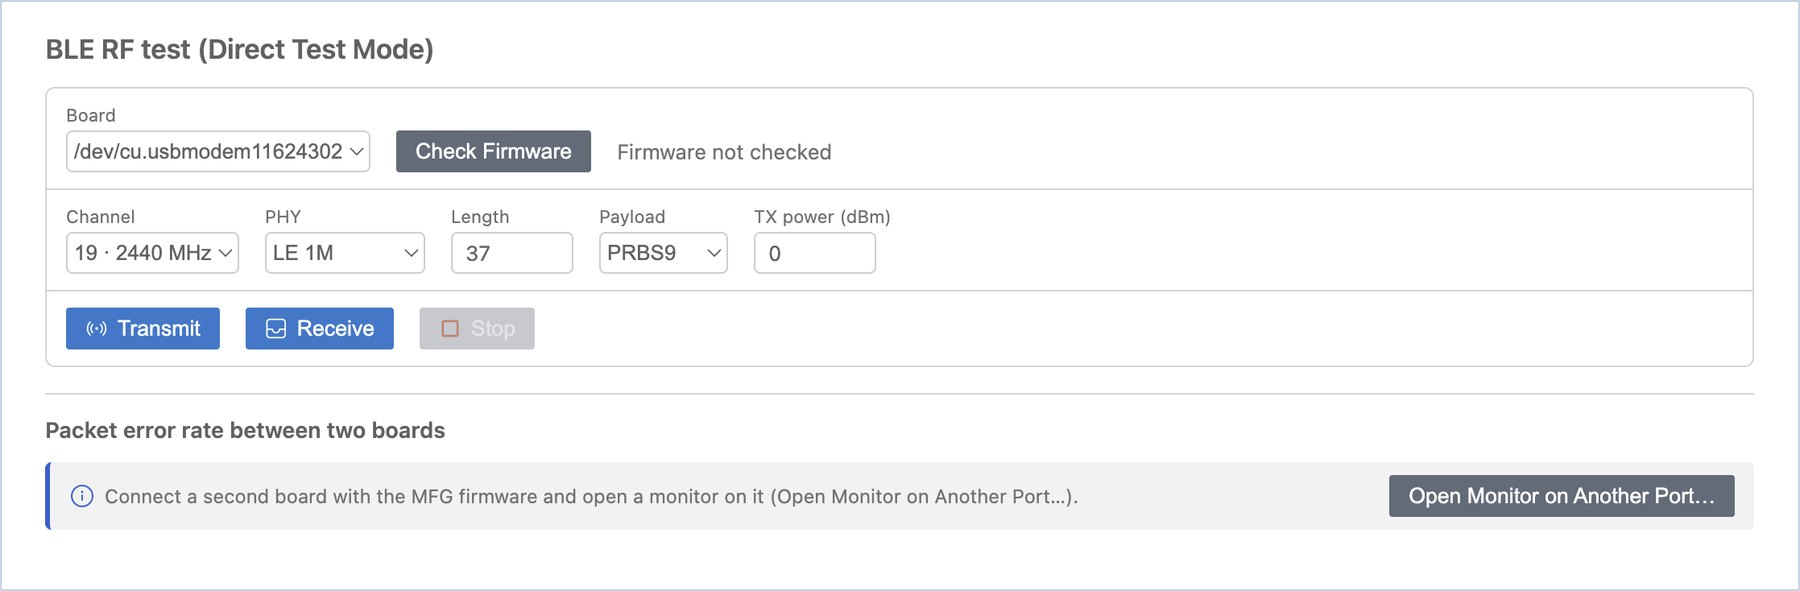
RF Test uses the MFG firmware from INTELPRO to make the board transmit or receive in BLE Direct Test Mode, for measurements with a spectrum analyzer or a radio communication tester, or to measure the packet error rate (PER) between two boards.
-
Check the firmware. Flash the MFG firmware to the board and open the serial monitor. Click RF test (DTM) under Tools on IPRO Home (or choose RF Test (DTM)… from the IPRO menu) and click Check Firmware. The MFG firmware is not included in the IPRO SDK; ask your INTELPRO sales representative for it.
You should see: "MFG firmware 1.01". When the board does not answer, it shows "The board did not answer. Is it running the MFG firmware?"
-
Transmit or receive. Select the channel, PHY, length, payload and TX power, click Transmit or Receive, and click Stop to end.
You should see: while transmitting, it shows a message such as "Transmitting on 2402 MHz (1M, 37 bytes, every 625 µs)." After receiving stops, it shows "Received M packets in N s; against a DTM transmitter at the standard rate that is a PER of X%."
When you only click Receive, the PER counts from the moment the board reports that it receives, and the expected number of packets is estimated from the standard DTM rate; the estimate holds when the transmitter sends for the whole time. To have the IDE control both ends, measure with two boards as in the next step.
-
PER with two boards. Connect both boards to the same computer, flash the MFG firmware to the second board too, and click Open Monitor on Another Port… to open its monitor. In Packet error rate between two boards, select the receiver and the number of seconds, then click Measure PER.
You should see: the result table gains a row: time, channel, PHY, sent (expected), received and PER.
When the two boards are on different computers, open IPRO Workbench on each computer: first select a channel on one and click Transmit, then select the same channel on the other and click Receive, and click Stop after a few seconds. The receiving side shows the number of packets received and the estimated PER.
Tip
With Wi-Fi nearby, BLE channels that overlap a Wi-Fi channel lose many packets (for example around 2440 MHz). When you measure PER, choose a channel clear of the nearby Wi-Fi, for example 2478 MHz.
Note
Each time a test starts, the MFG firmware first has to start the BLE controller (about 2.5 seconds); the IDE waits for its reply before it starts.
Wi-Fi Throughput (iperf)
Wi-Fi throughput runs a TCP iperf test between this computer and the board to measure the Wi-Fi throughput. IPRO Workbench runs the computer's side itself, so you do not need to install iperf; for the board's side the IDE types the commands through the serial monitor.
The application on the board must have the SDK's Wi-Fi shell commands and the iperf command. On the IPRO6S EVK use platform/ipro6_demo of IPRO SDK 2.2.1 (for flashing, see IPRO6S EVK in Flashing and the Board).
| Wi-Fi role | When to use it |
|---|---|
| Station (joins the network this PC is on) | The recommended way. The board joins the Wi-Fi network (2.4 GHz) the computer is already on; the computer's network stays as it is. |
| Access point (this PC joins it) | When there is no Wi-Fi network at hand. The board is the access point, and the computer's Wi-Fi has to join the board; while it does, the computer usually has no internet access. |
Putting the Board on the Network
-
Flash the application. Select
ipro6_demo, flash it to the IPRO6S EVK, and keep the serial monitor open. -
Open the page. Click Wi-Fi throughput under Tools on IPRO Home (or choose Wi-Fi Throughput (iperf)… from the IPRO menu).
You should see: the Wi-Fi Throughput (iperf) tab, with two parts: "1. Put the board and this PC on one network" and "2. Run". When no monitor is open, a hint at the top asks you to open one and offers the Open Monitor button.
-
Join the network. Under Wi-Fi role, choose Station (joins the network this PC is on); under Network name, enter the name of the Wi-Fi network the computer is on; under Password, enter its password; then click Join Network.
You should see: the status message shows "The board is joining <network name>…" and then "The board joined <network name>; its address is <board's IP>."; Board's IP address is filled in for you. The log below lists the commands the IDE sent to the board (starting with →) and the board's replies (starting with ←):
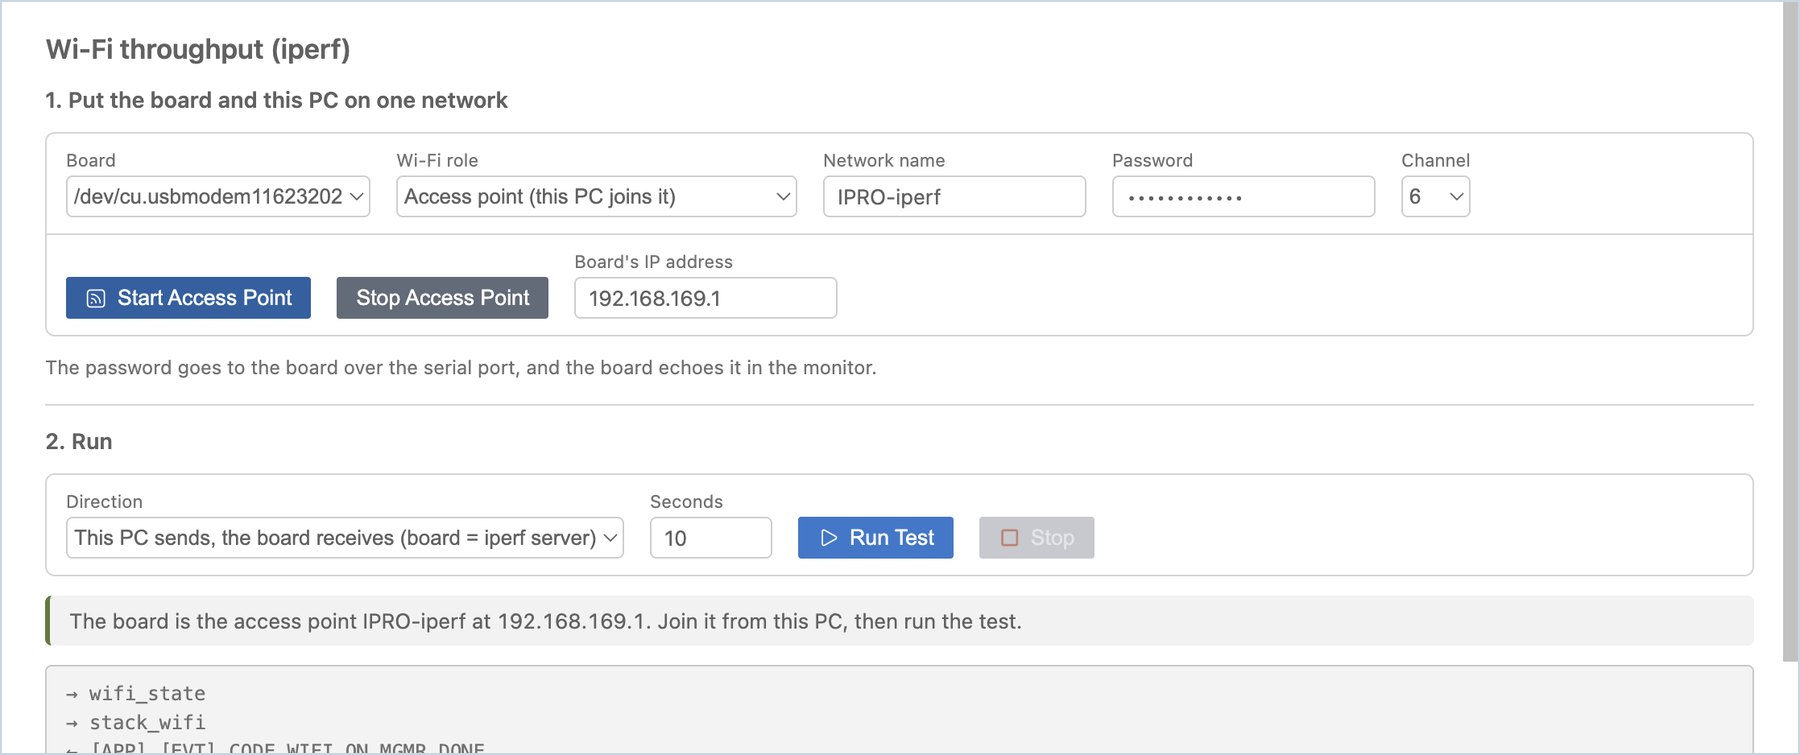
wifi_state,stack_wifi,wifi_sta_connect; the password is shown as********in this log. If the board has not joined within about 40 seconds, the message is "The board did not join <network name>. Check the name and password."To use the access point mode instead, choose Access point (this PC joins it) under Wi-Fi role, enter the name of the network to create, a password of 8 to 63 characters and a channel, and click Start Access Point.
You should see: "The board is the access point <network name> at 192.168.169.1. Join it from this PC, then run the test." Then join that network in the computer's Wi-Fi settings.
Important
- The network name and the password cannot contain spaces: the board's shell cannot take a space. With a space in either, the IDE sends nothing and shows "The network name must be 1 to 32 characters without spaces" or "The password must be 8 to 63 characters without spaces."
- The password goes to the board over the serial port, and the board echoes it in the serial monitor (the tool page's own log does not show it). With Log To File on, the password also stays in the monitor log file; delete that line before you give the monitor output or the log file to anyone else.
Running the Test
-
Run the test. Leave Direction at This PC sends, the board receives (board = iperf server), enter the test time under Seconds (10 by default), and click Run Test.
You should see: the status message shows "This PC (<PC's IP>) sends to the board (<board's IP>) for 10 s…", and the line below lists the Mbit/s that the board and the computer count each second. At the end the status message shows "Done: … Mbit/s by the board's count, … Mbit/s by this PC's.", and the results table gets a new row: direction, time, amount transferred, the board's count, this PC's count, and the board's figure for each second.
-
Measure the other direction. Change Direction to The board sends, this PC receives (board = iperf client) and click Run Test again.
You should see: a new row "Board → PC" at the top of the results table.
-
Stop and leave the network. To end a test early, click Stop. When you are done, click Leave Network (Stop Access Point in access point mode) so the board leaves the Wi-Fi network.
| Direction | Who waits for the connection | Notes |
|---|---|---|
| This PC sends, the board receives (default) | The board (iperf server, TCP port 5001) | Nothing to change in the computer's firewall |
| The board sends, this PC receives | This computer (TCP port 5001) | The computer's firewall must allow incoming TCP 5001. Windows blocks it by default; see below |
Note
- Windows firewall: when the board sends and the computer receives, and the status message is "The board did not connect to this PC on TCP port 5001. A firewall on this PC may block incoming connections…", add an inbound rule in "Windows Defender Firewall with Advanced Security" that allows TCP port 5001 (for the profile of the network the computer is on, Public or Private); you can disable or delete the rule after the test. Adding a rule needs administrator rights. Sending from the computer to the board needs no rule.
- A board server left waiting: once the board's iperf server waits for a connection, only a connection from a computer or a restart of the board ends it. So the IDE first checks that this computer has an address on the board's network before it lets the board start its server; if it has none, the message is "This PC has no address on the board's network (…). Join the same Wi-Fi network, then run again." When a server is already waiting (the status message is "This PC could not reach the board's iperf server…" or "An earlier iperf is still running on the board…"), click the Reset Board button that appears; after the board restarts, start again from Join Network.
- The board and the computer each count for themselves: the board from the data it received (or sent), the computer from the data it sent (or received). A small difference between the two figures is normal.
- Figures measured in the two Wi-Fi roles cannot be compared with each other. To evaluate the throughput of a board that is connected to an access point, use the Station mode.
Power
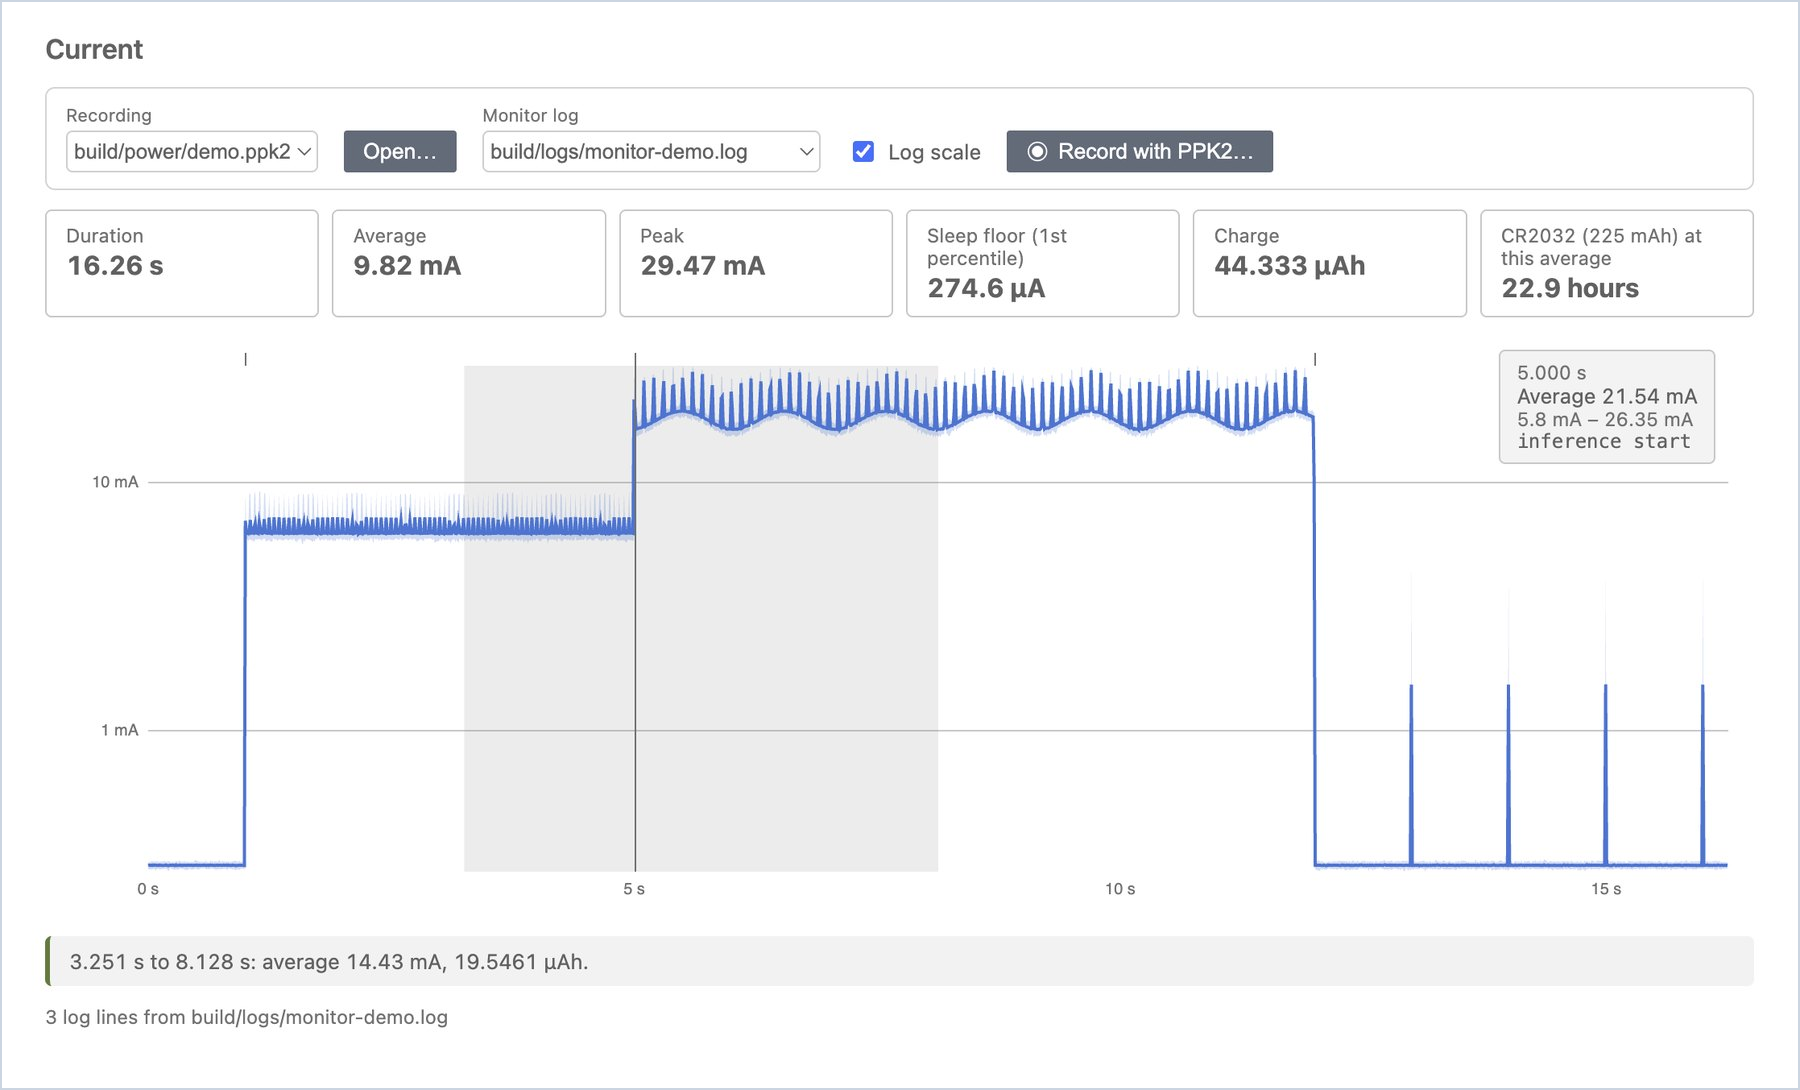
Power reads current recordings from a Nordic Power Profiler Kit II (PPK2), works out the average, peak, sleep current and charge, and estimates how long the board would run on a CR2032.
-
Open a recording. Right-click the application and choose Power… (or click Power under Tools on IPRO Home), click Open… and choose a
.ppk2or CSV file saved by the Power Profiler.You should see: the duration, average, peak, sleep floor (1st percentile) and charge, and how long it lasts under "CR2032 (225 mAh) at this average"; below them is the current curve, which you can switch to Log scale.
-
Hover over the curve.
You should see: the time, average current and range at that moment, for example "8.128 s, Average 282.3 µA, 271.4 µA – 292.5 µA".
-
Measure a stretch. Press and drag across a stretch of the curve.
You should see: the average current and charge of that stretch appear below, for example "3.251 s to 8.128 s: average 11.91 mA, 16.1279 µAh."
-
Line up the monitor log. If the serial monitor had Log To File and timestamps on during the recording, select that log in Monitor log.
You should see: each log line is marked with a short tick above the curve; hovering over a tick shows the current at that moment and the log text, so you can see "which part of the code used how much power".